From Oura Ring to Dataset: Analyzing and Visualizing a Year of Biometric Data
Visualizing and analyzing sleep, heart rate, HRV, activity, stress, and SpO2 data from the Oura Ring API
February 16, 2026
Early last year I moved to SF and, not long after, bought an Oura Ring [1]. I've always been drawn to the quantified self idea (and it didn't hurt that I liked the aesthetics of the ring).
I had been thinking about getting one for a while, but two things finally pushed me over the edge:
- Living in the U.S. where you can order something in the morning and have it the same day (a big change from Serbia).
- Andrej's blog post [2] comparing different sleep trackers. :)
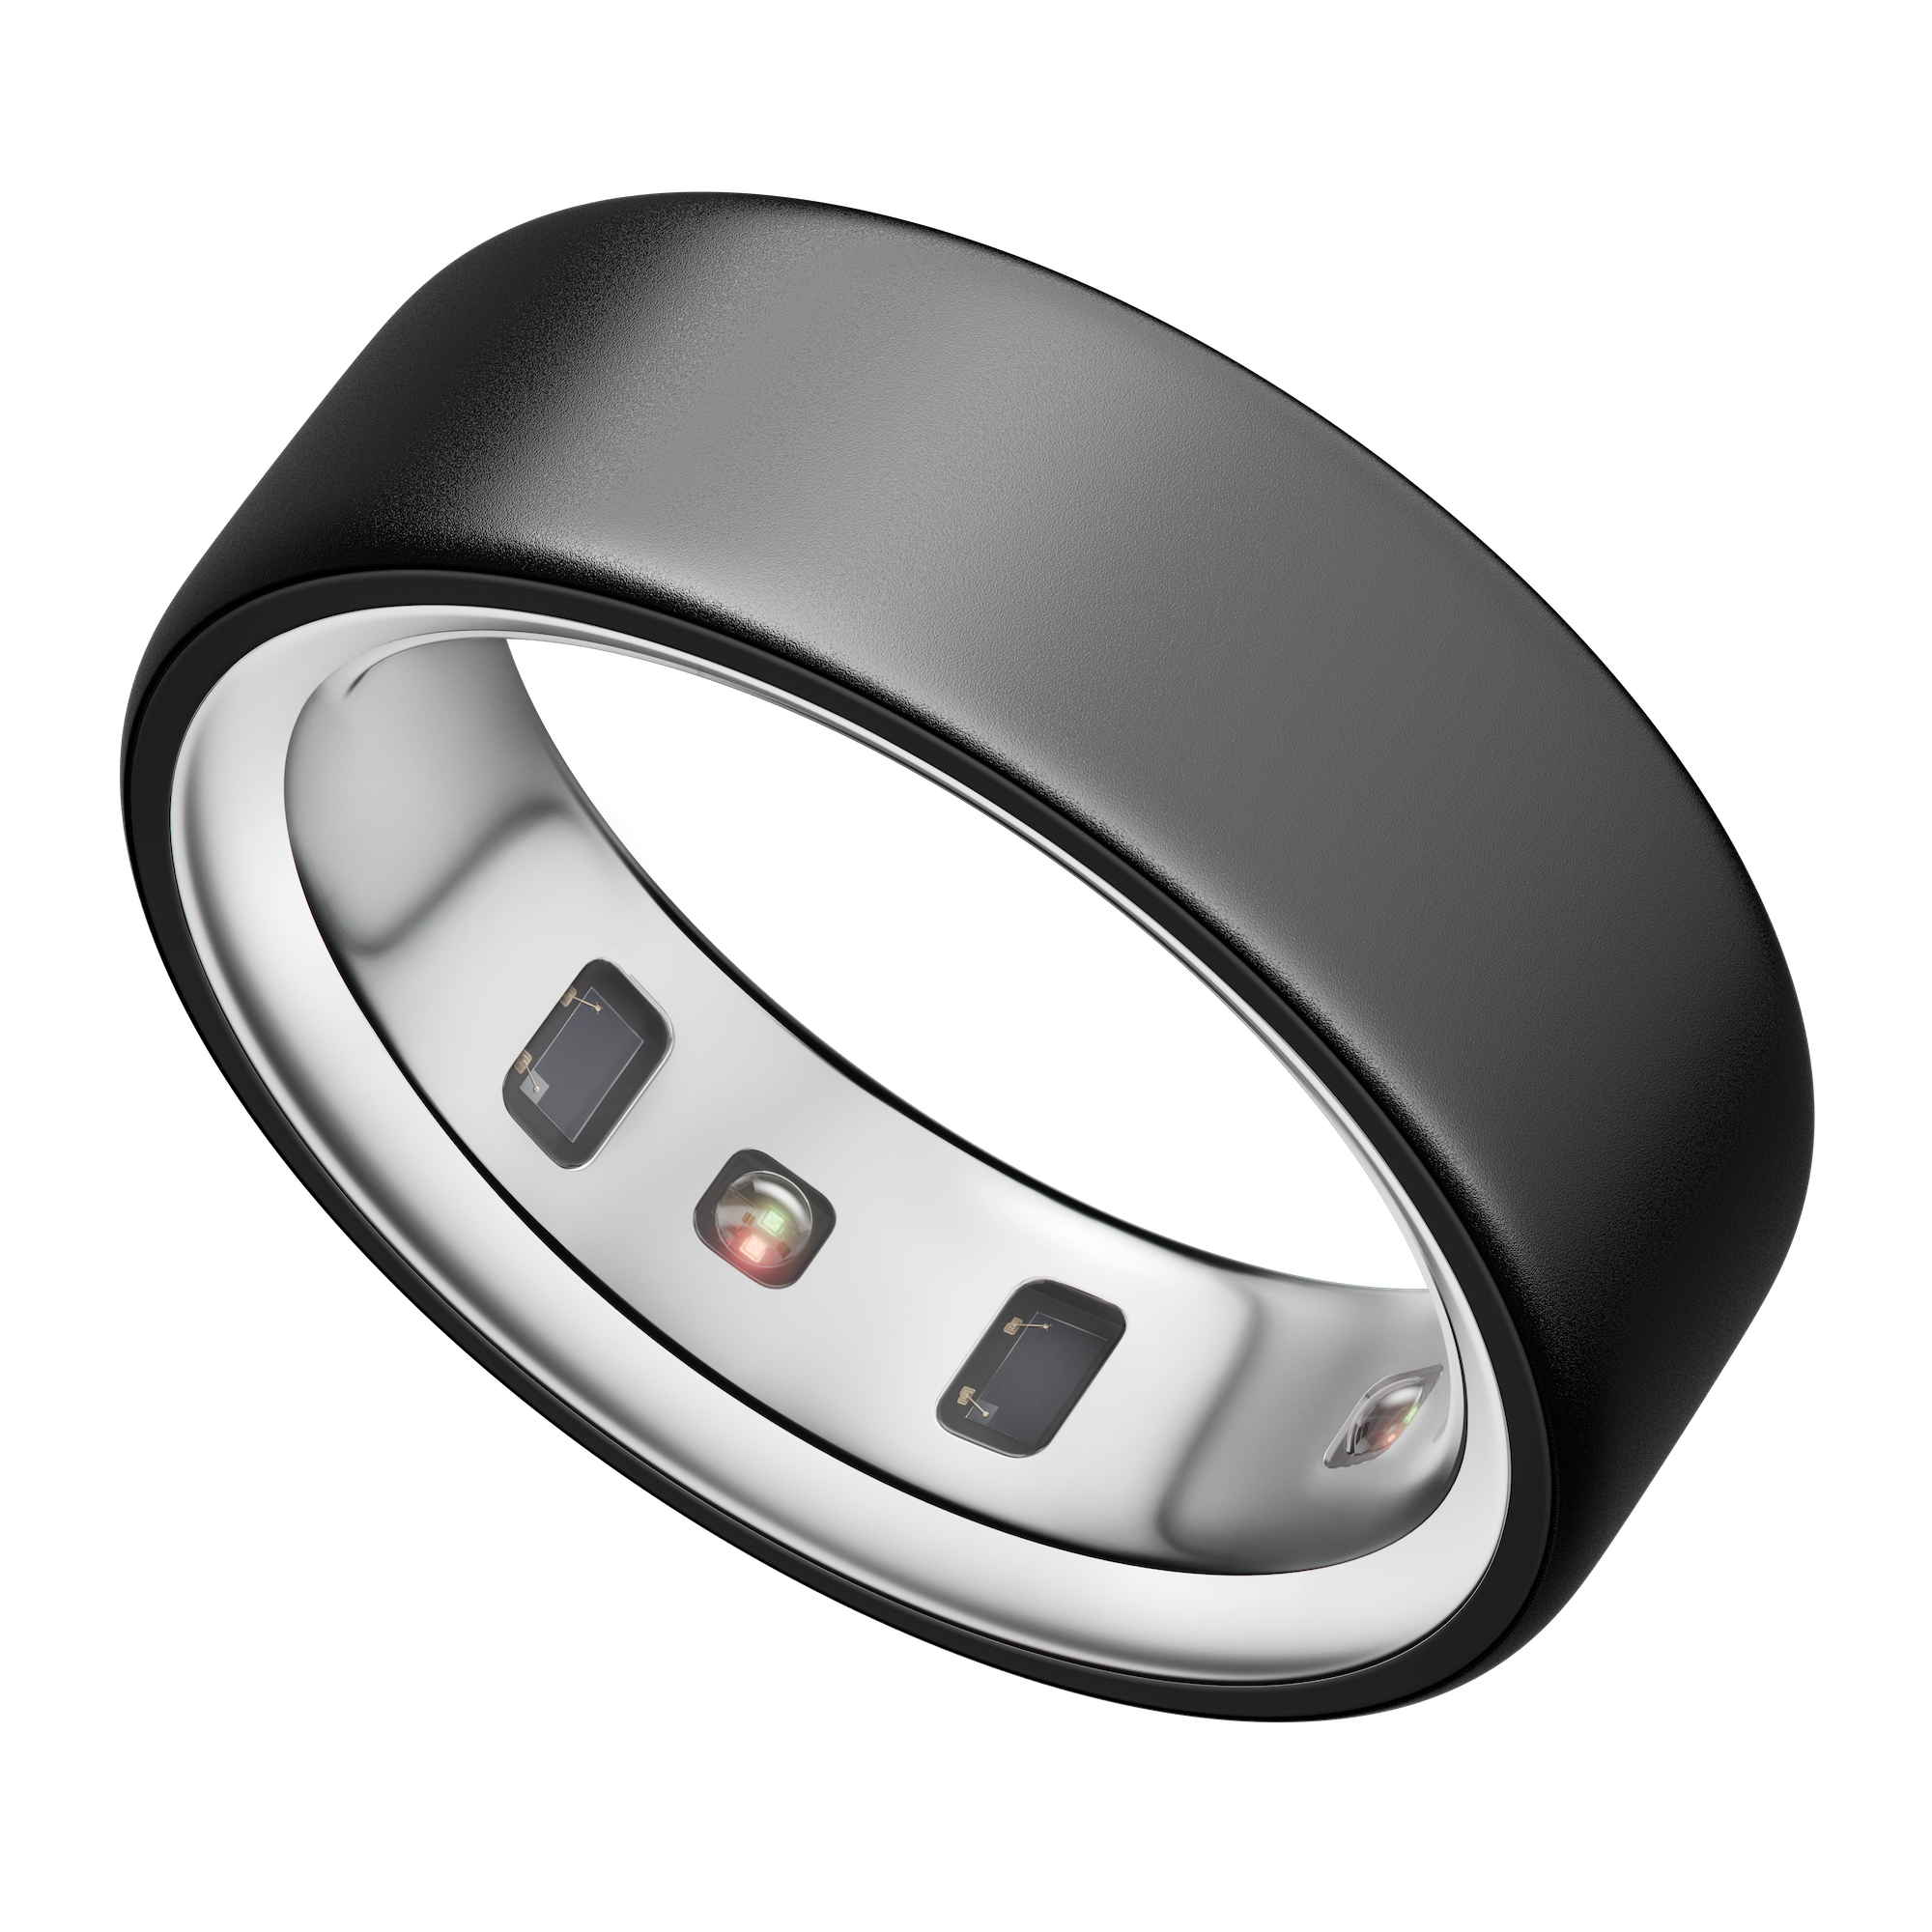
The ring measures a range of biometrics. My primary motivation was simply to track my sleep, but it turns out it captures far more data than I initially realized.
Pretty quickly I noticed something interesting in my heart rate and HRV patterns during sleep: my heart rate drops as low as 34 bpm during the night. I knew that marathon runners and other endurance athletes can have unusually low resting heart rates, but I didn't expect to see myself anywhere near that category:
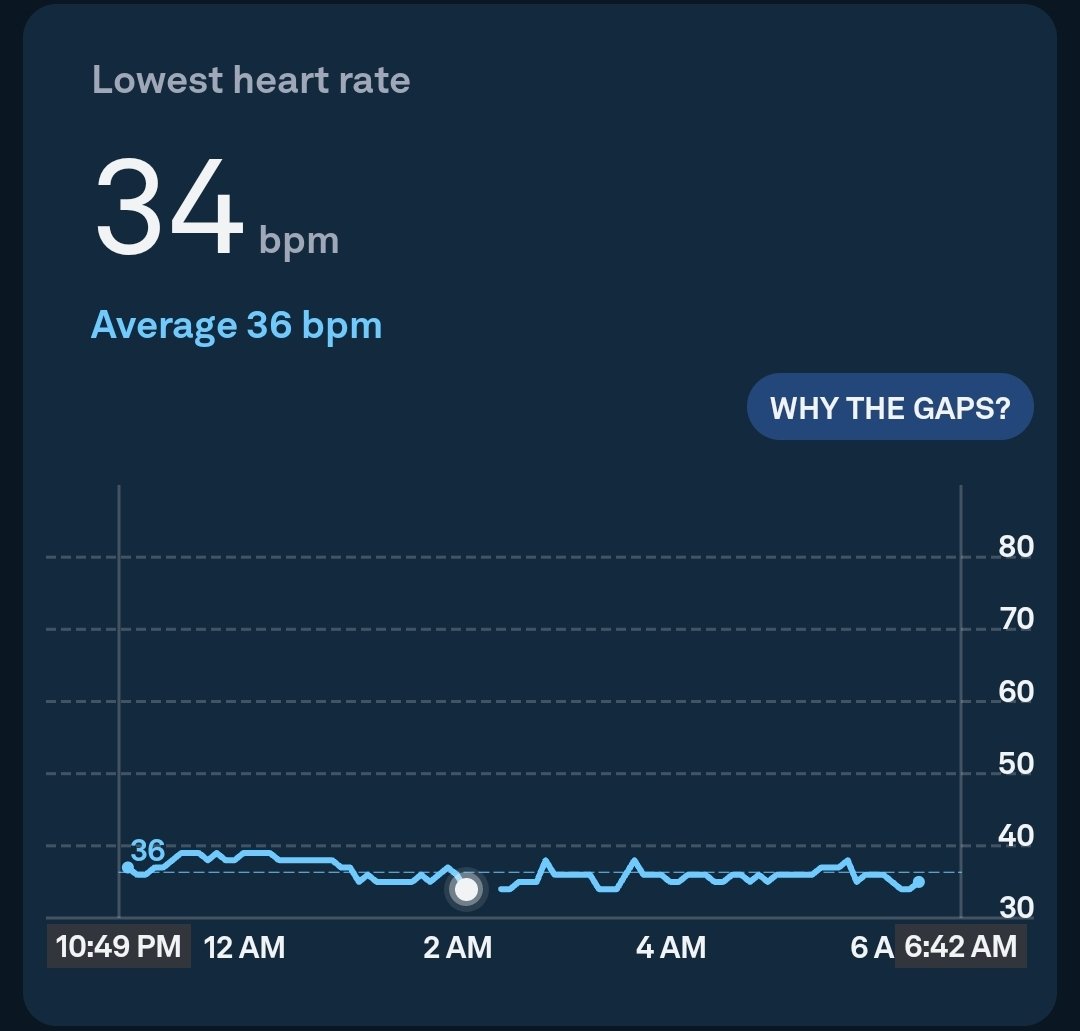
At the time this snapshot was taken, I was running every day and doing calisthenics. I've also been working out consistently since I was 12, mostly figuring things out on my own, so that probably explains it.
Oura comes with a fairly good mobile app, but I found it difficult to answer the kinds of questions I had in mind. So I pulled the data from their API and built a small health dashboard for myself.
It's hard not to think about where this could go. Imagine being able to measure most relevant biometrics and biomarkers in real time, and having an AI system continuously analyze the data, helping you adjust nutrition, suggesting changes to sleep habits, or calling 911 when something is going wrong.
Even in the shorter term, there's a more practical point: doctors could have access to far richer longitudinal data than they do today. Right now, most clinical decisions are made from a handful of measurements and a brief conversation in an office. Compared to continuous streams of physiological data, that's extremely low bandwidth.
Right now, the dashboard contains everything from the day I bought the ring, April 4th, 2025, up until February 15th, 2026.
The API [3] exposes a lot of metrics. I removed most of the proprietary composite scores (as they are less interpretable) and focused on a smaller subset that I care about.
I grouped everything into five categories:
Let's go over each of these. You can also explore the live interactive dashboard at: aleksagordic.com/health [4]
In the future, I might expose an endpoint curl aleksagordic.com/health returning:
200 OK- if things look stable503 Service Unavailable- if I slept three hours and my body is effectively rate-limited410 Gone- or maybe not if Bryan figures out a workaround first
On second thought, publicly exposing my real-time biometrics might not be the smartest idea. Then again, I also run my agents with --dangerously-skip-permissions.
Sleep
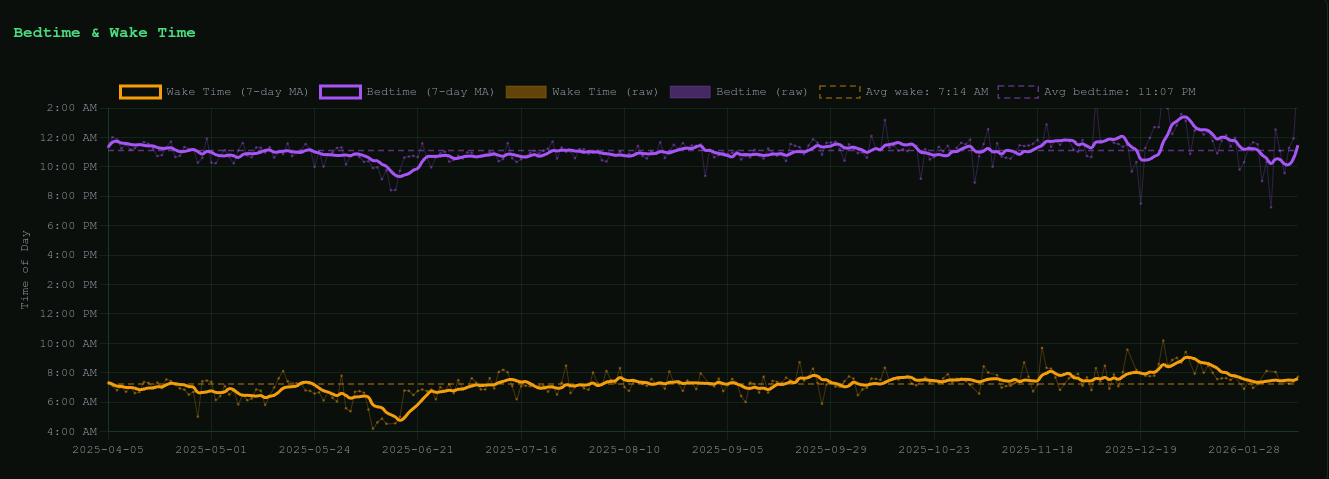
On average, I go to bed around 11 pm and wake up around 7 am.
That hasn't always been the case. E.g. back in 2023-2024, when I was running my startup, my schedule at one point drifted closer to 4 am to 11 am.
These days I aim to be in bed between 10:30 and 11 pm, so I'm slowly converging toward that. Interestingly enough, both schedules work for me. In former I feel more productive at night, in latter I feel more productive in the morning.
I suspect the bump toward the end of December is due to being in Hawaii (Maui+Oahu) around xmas and New Year's, which shifted my schedule by about two hours.
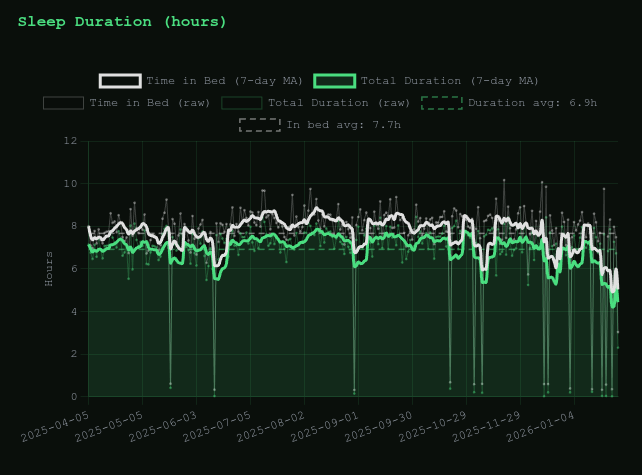
On average, I sleep 6.9 hours, but I spend about 7.7 hours in bed. The difference likely comes from sleep latency (how long it takes me to fall asleep) and a bit of time in the morning while I write down my dreams. I started keeping a dream diary early last year as well. I think of it a bit as debugging logs.
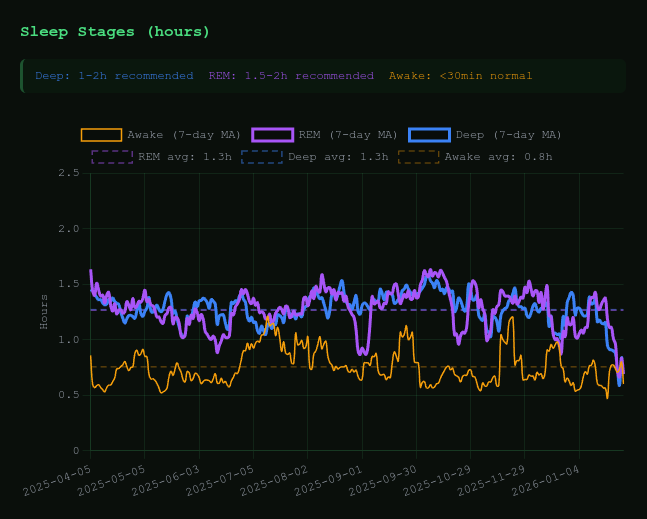
On average, I get about 1.3 hours of both deep sleep and REM. I'd like to push each of those above 1.5 hours. This is likely something I can improve by being more deliberate about what I do before bed. (e.g. surprise, surprise I found out that adrenaline-inducing movies do not help, but dimming lights, eating 3+ hours before sleep, controlling stress levels, hot shower, sex, etc. do).
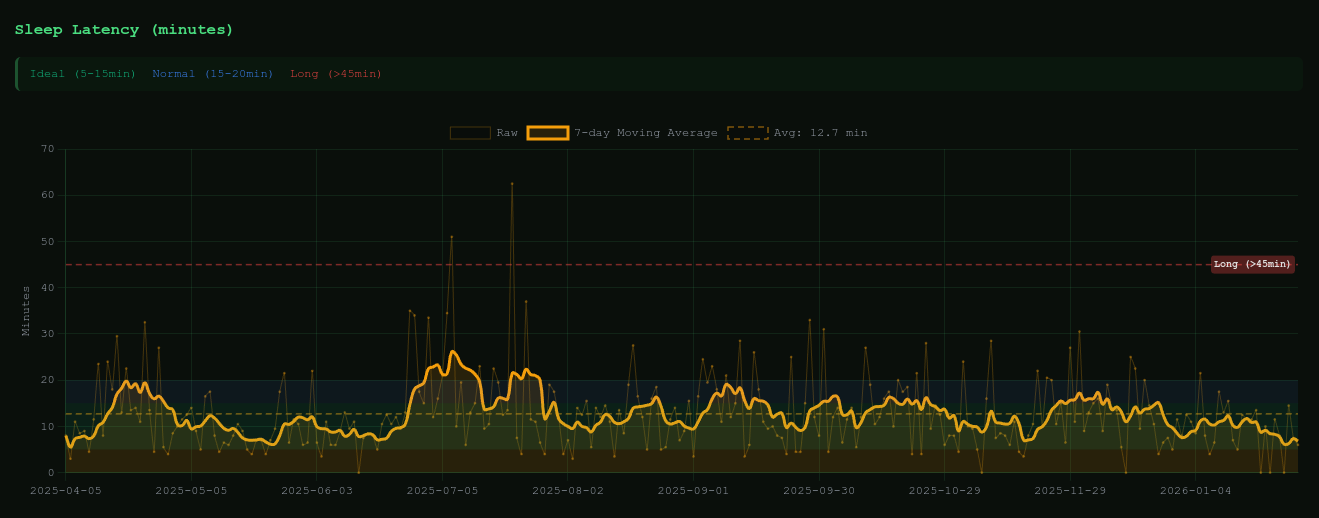
It usually takes me about 12.7 minutes to fall asleep, which I'm fairly happy with. There were a few outliers last summer that coincided with the period when I left my startup. It was less about stress and more about being more determined than ever to make it. That kind of ambition right before sleep is usually not recommended, heh.
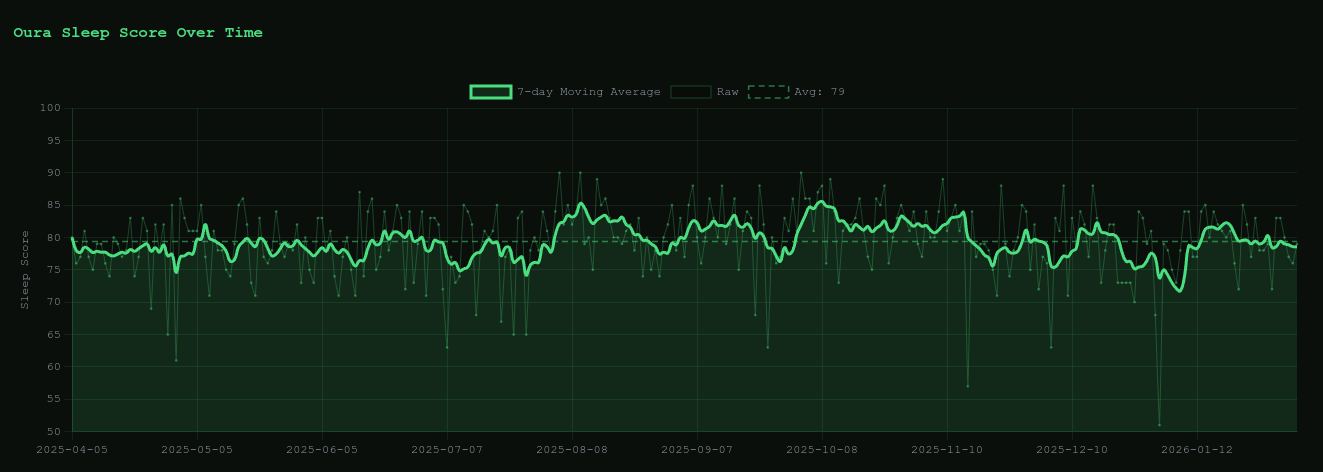
Overall, my average Oura score is 79, which is close to the “Excellent” category. It's a somewhat opaque composite metric, so I pay less attention to the absolute number and more to how it changes over time, i.e., I believe it has a nice property that maximizing it likely means I did improve my sleep.
The main takeaways for me are that I should work on increasing my REM and deep sleep and aim to go to bed between 10:30 and 11 pm. Overall, though, my sleep quality is quite good.
Next up cardiovascular health.
Heart rate and HRV
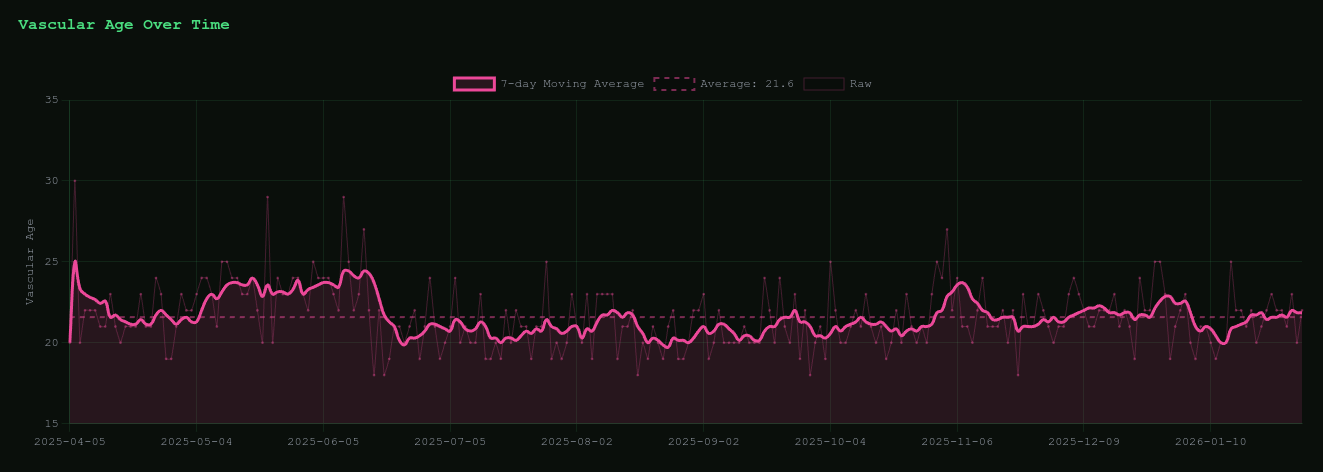
This is the last obscure metric I'll share, but I do like the sound of having the heart health of a 21.6-year-old. I'm not sure how they compute it, though. I should probably dig into that a bit.
I have professional-athlete-level numbers during the night, with an average heart rate of 42.8 bpm and an average nightly low of 37.4 bpm:
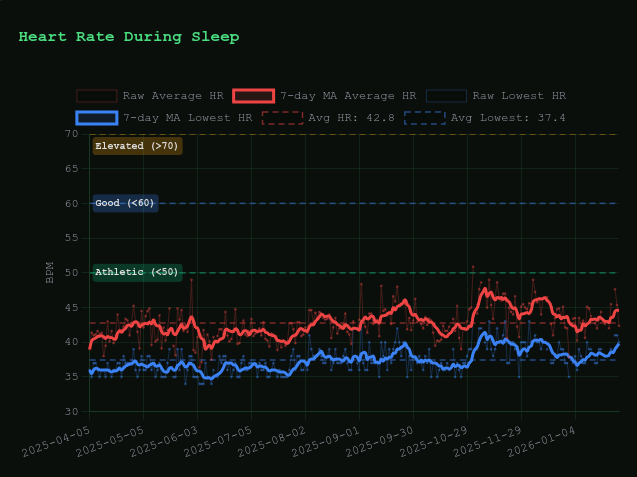
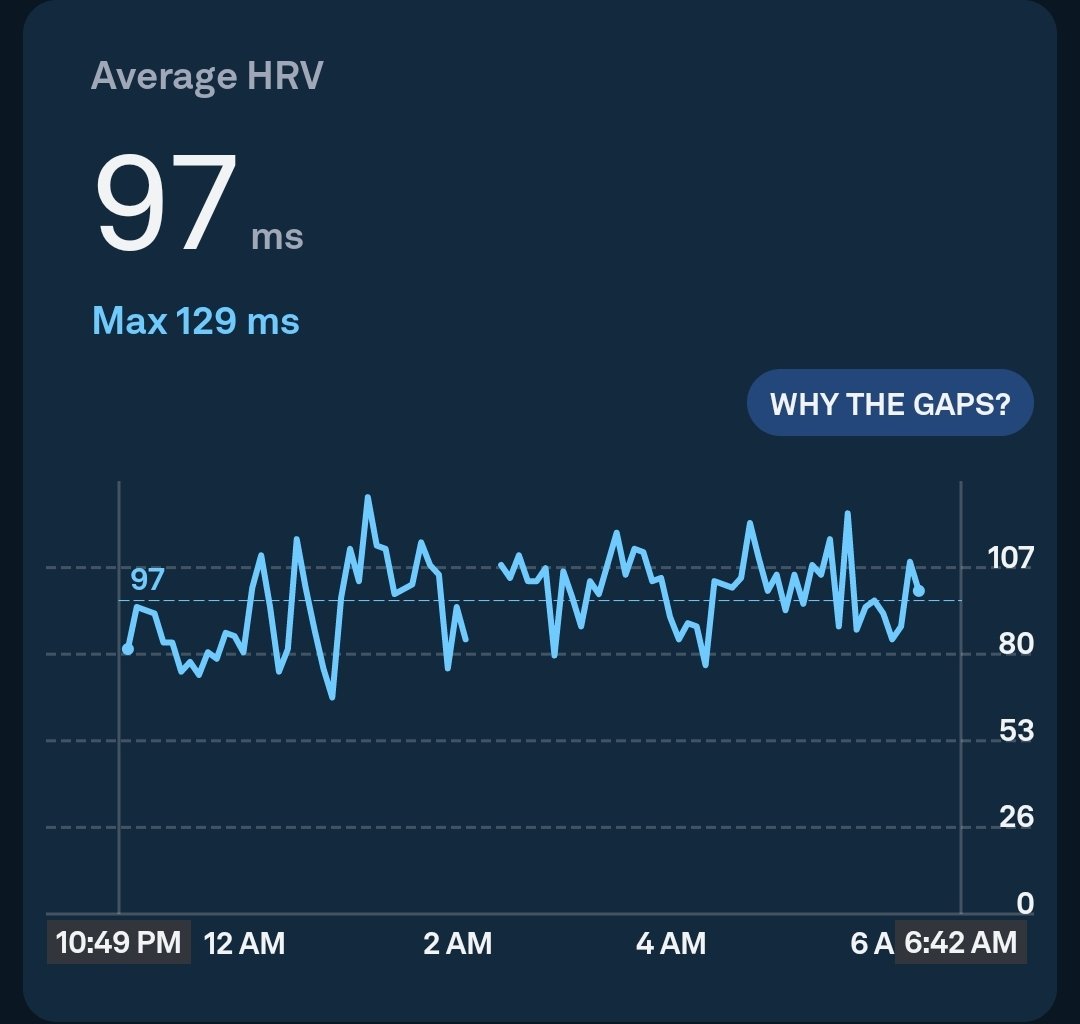
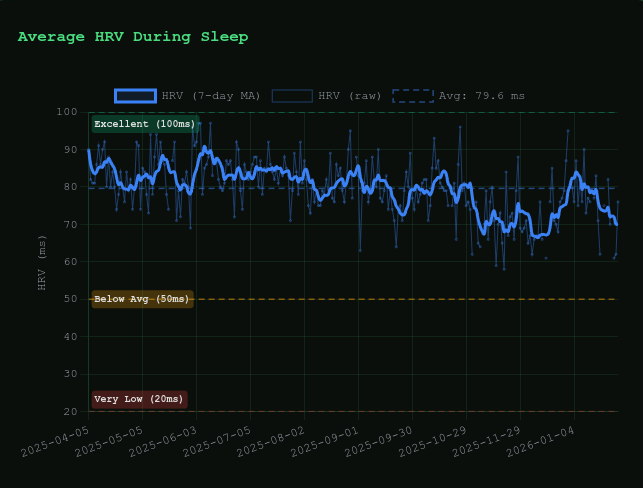
My HRV levels fall into the good-to-excellent range. That said, both my resting heart rate and HRV seem to be trending slightly in the wrong direction. My current hypothesis is that this shift coincides with moving away from cardio-heavy workouts toward strength training. I started doing heavy squats last summer and worked up to a 140 kg one-rep max. This year's goal is 200 kg (440 lbs). That's my main side quest.
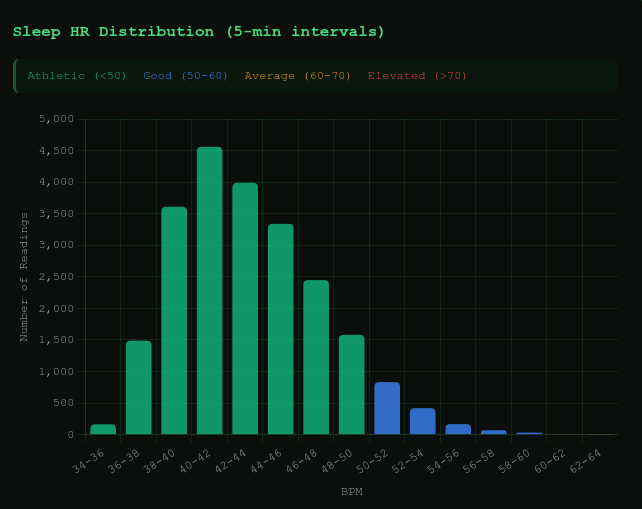
Taking a slightly different look and using fine-grained data (5-minute intervals), the story looks similar: the mode of the distribution is around 40-42 bpm.
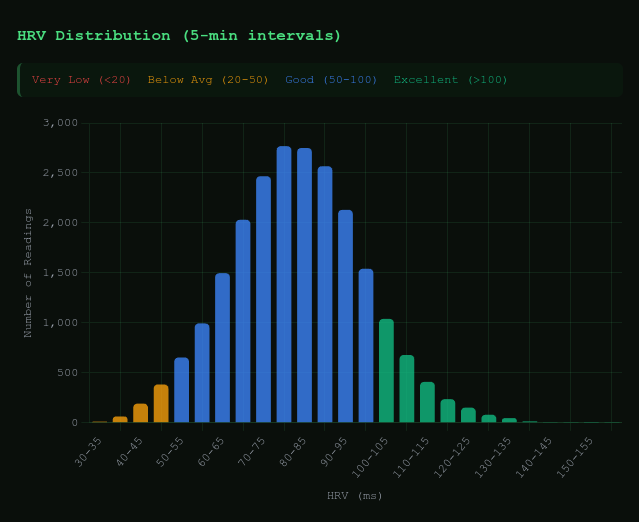
And here is HRV histogram:
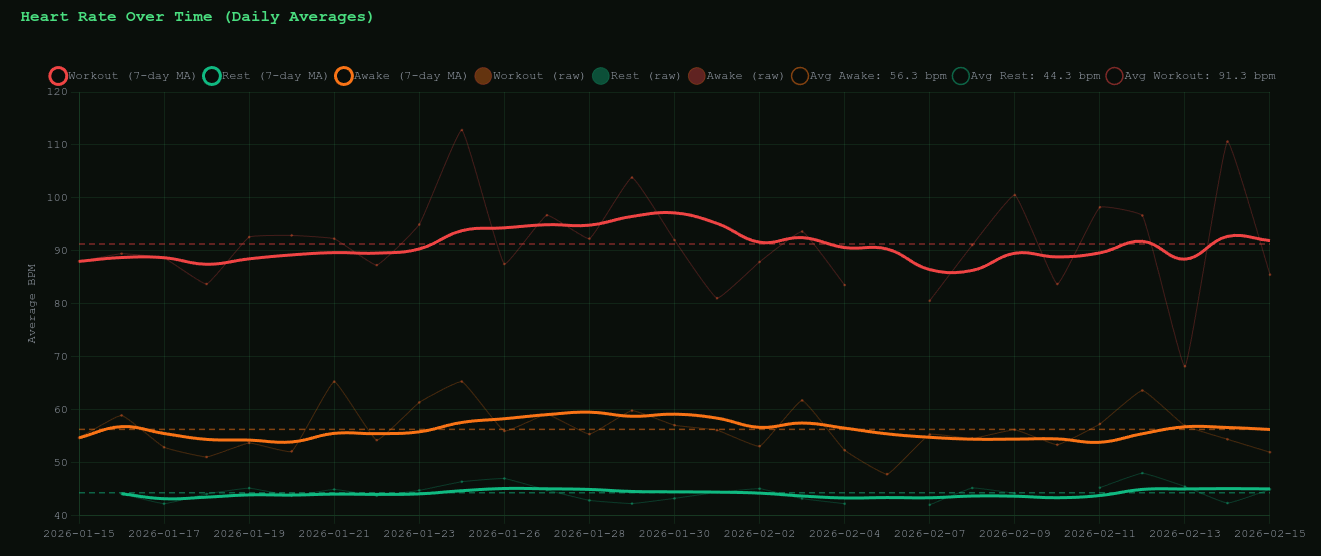
Shifting the focus away from sleep to waking hours, my average workout hear rate is 91.3 bpm, and my average awake heart rate is 56.3 bpm. Unfortunately, Oura only exposes roughly a month of data for this metric (I guess I'll start pulling it from the API more regularly now).
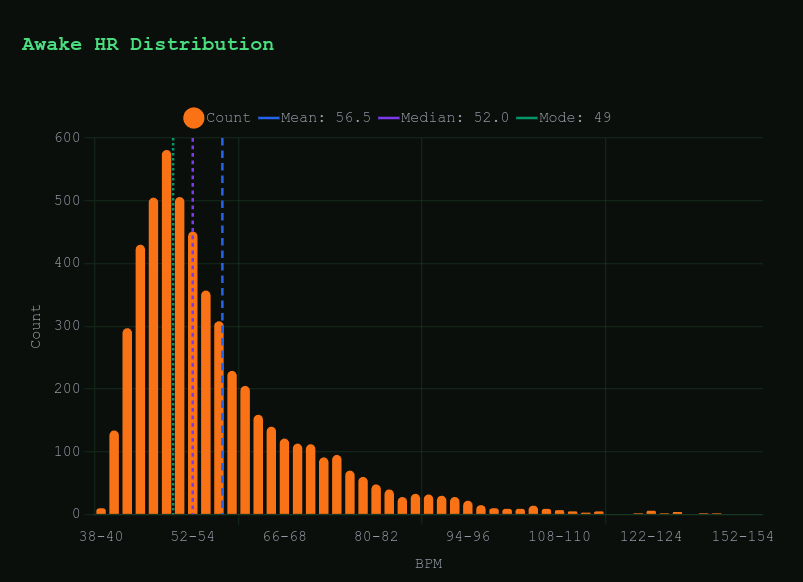
Looking at the same data in histogram form, the mode is 49 bpm, but the long tail pulls the mean up to 56.5 bpm. That raises the question: is this a workout mislabeled as awake heart rate, or was I just unusually stressed? It could be both.
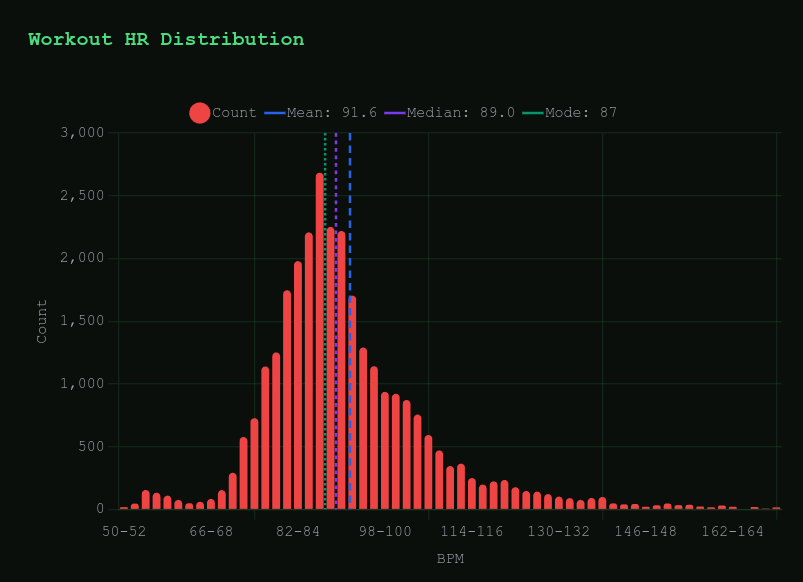
And here is my workout HR histogram:
Overall, my cardiovascular health looks good. I've also started running more regularly again (2-3 times a week), which should help improve my HRV. I've already noticed that I recover faster from squats.
Activity
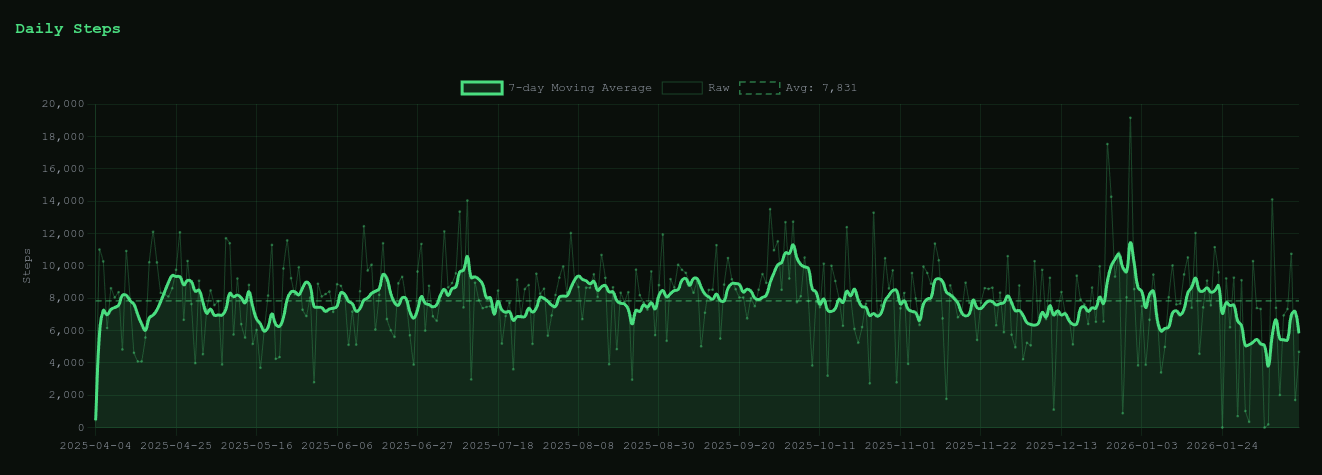
It looks like I average 7,831 steps per day. I'm somewhat skeptical about the reliability of this metric, though, since I bike quite a bit. It's not entirely clear what exactly triggers the step counter to increment +1.
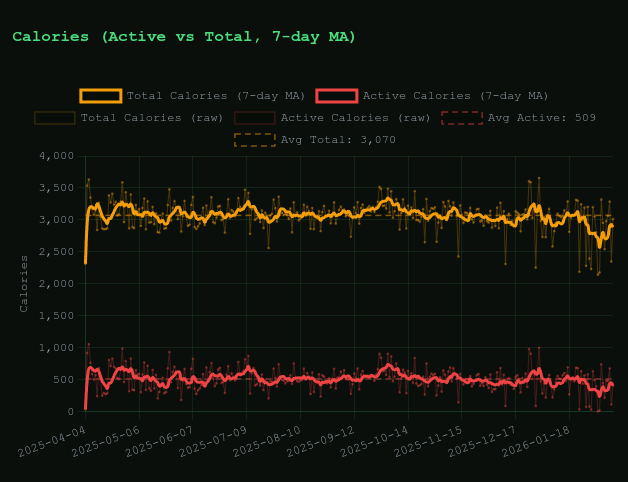
On average, I'm burning about 3,070 calories per day, with most of that surprisingly coming from my basal metabolic rate and only 509 from activity. I'm a bit skeptical about the accuracy here as well, I would have expected a much higher active calorie expenditure.
My body weight is stable at around 105 kg (231.5 lbs), so when it comes to calories, I mostly care that I'm roughly in balance between how much I burn and how much I take in. Most of my daily expenditure likely comes from basal metabolism and mental work rather than physical activity.
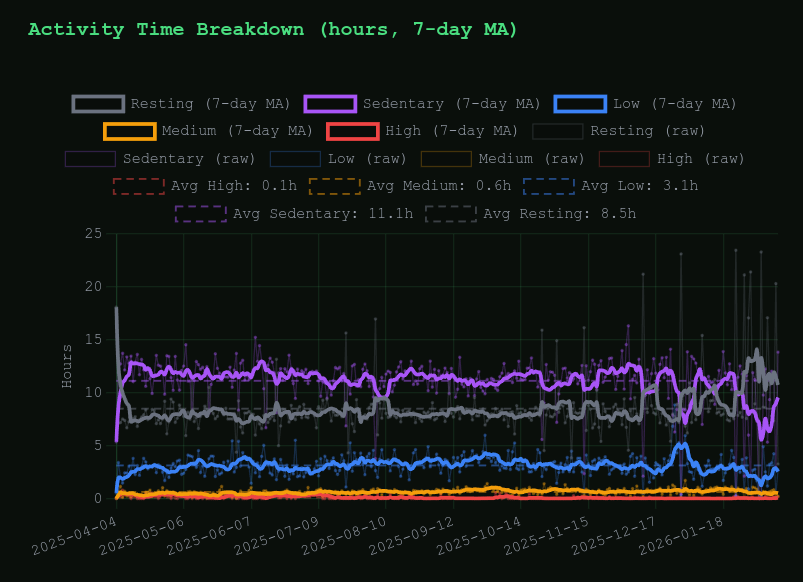
Unsurprisingly, I lead a mostly sedentary lifestyle with bursts of high-intensity activity (running or gym sessions).
Adding up the average high and medium-intensity time comes to about 0.7 hours per day, or roughly 42 minutes, which feels accurate (given that I also have rest days which pull down the average).
A heavy squat workout usually takes around 35-45 minutes. Running plus calisthenics is closer to an hour and 15 minutes. The rest of the time, I'm at my computer working. I also like to walk/bike a lot so that probably accounts for a part of the low-intensity activity.
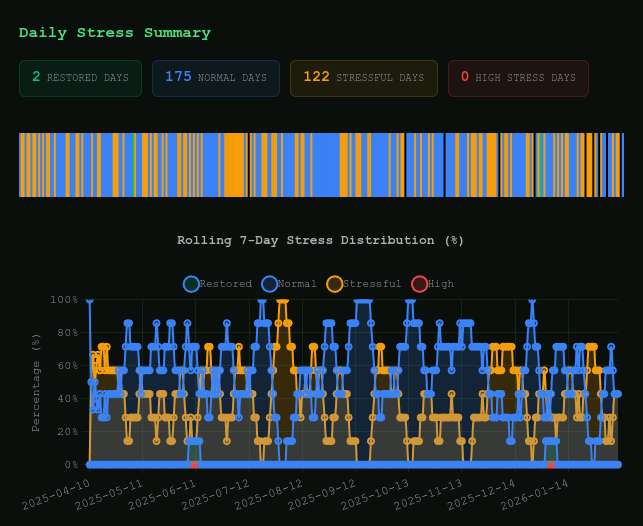
Stress
Apparently, I'm "stressed" for about 2.8 hours per day - lol. I'm not entirely sure how this is measured; it all feels a bit like dark magic. It's also unclear whether the metric is calibrated relative to my personal baseline.
I tend to be naturally hyperactive and high-energy (which is why I don't drink coffee). Most of that energy turns into productive output, and occasionally into a more negative or self-destructive. I'm not sure which blend of that the device is interpreting as stress, or how my numbers compare to other Oura users.
My recovery time averages about 0.8 hours per day, which sounds low? It might be a sign that I need to slow down a bit and give myself more time to unwind. Perhaps my sympathetic nervous system is more active than it should be.
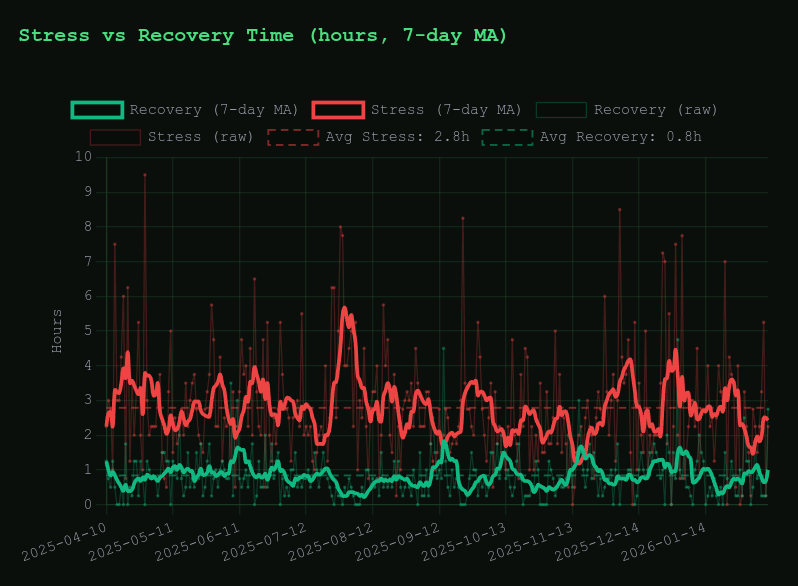
Taking a different view, the curves below show the number of stressful versus normal days over a rolling 7-day window. Qualitatively, this feels accurate, my subjective stress levels were very high last summer.
I channeled much of that into peak productivity. Part of that window included writing my last two blog posts on the vLLM inference engine and matmul kernels (that led to few AI labs reaching out to hire me as perf engineer). It also feels like that period permanently shifted my baseline — I've rarely been as productive and focused as I've been over the past 6-9 months.
Overall, I do need to work on activating my parasympathetic nervous system more, finding more time to be bored and relaxed. This means socializing a bit more with people I love, and traveling every 3-4 months.
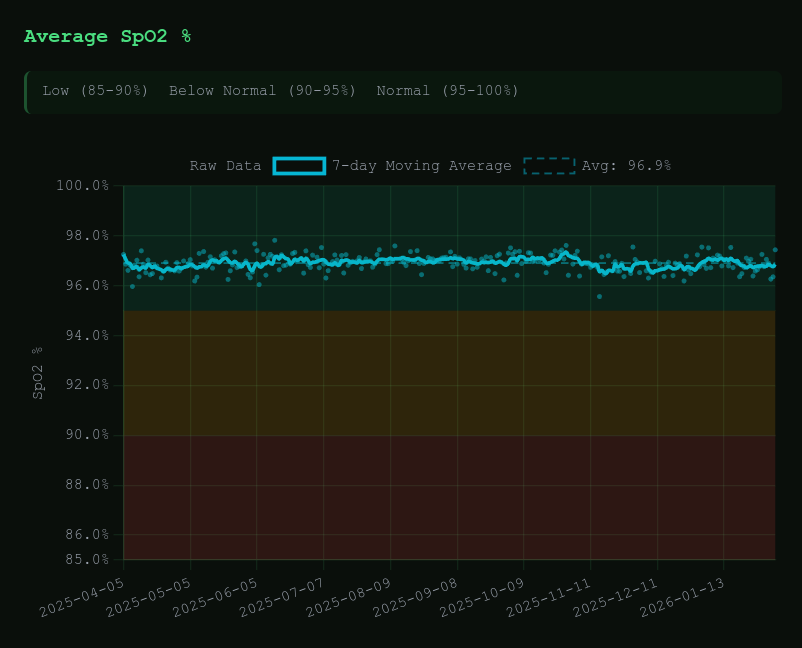
Blood oxygen and breathing
It looks like my SpO₂ levels (which measure the percentage of oxygen-saturated hemoglobin in the blood) average around 96.9%, which is within the normal range. I don't snore, at least as far as I or my wife know, but I've been tempted to film myself during sleep to detect anything unusual, including the onset of snoring or apnea.
It shouldn't be too hard to spin up a simple video classification pipeline on my deep learning rig and connect it to my home camera (bought a Reolink cam few months ago). :) I'll add that to the list of side quests.
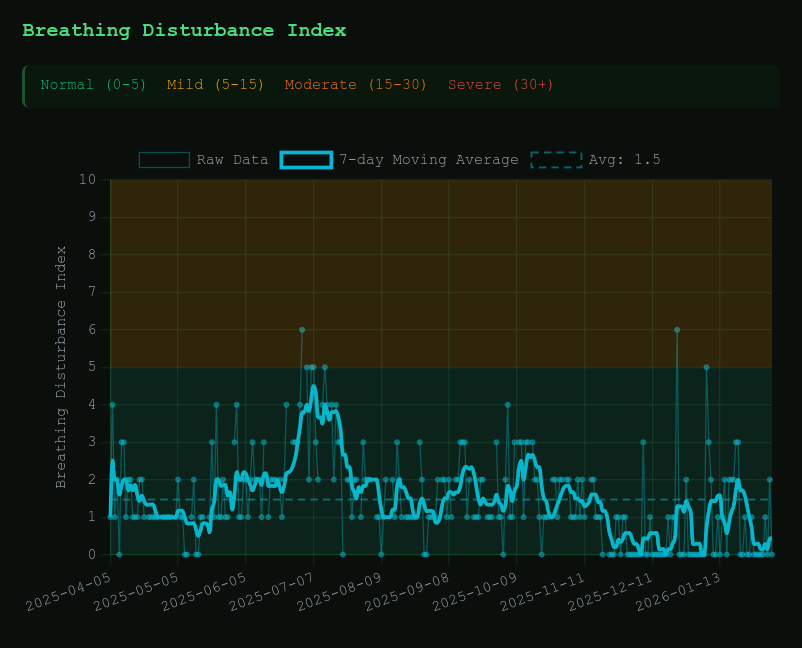
My breathing disturbance index is low, at just 1.5. Apparently, once it crosses 5, it's worth starting to ask questions so I should be good.
And my breathing rate averages 17 breaths / min:
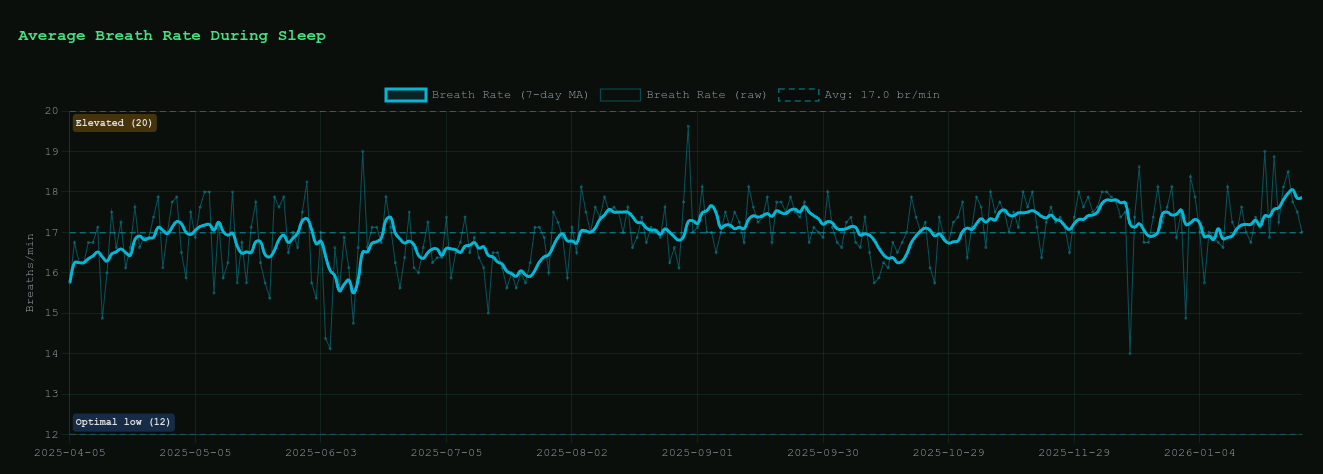
Here, I'd like to experiment with filming myself during the night to see if I should be focusing more on nasal breathing.
This was a fun little side quest! Overall super happy I bought the Oura ring, I might be experimenting with more gadgets in the future. Lmk if you have any fun recommendations.
Get notified when I publish a new post.
References
- Oura Ring https://ouraring.com/
- Andrej Karpathy, "Finding the Best Sleep Tracker" https://karpathy.bearblog.dev/finding-the-best-sleep-tracker/
- Oura Ring API Documentation https://cloud.ouraring.com/v2/docs
- Live Health Dashboard https://www.aleksagordic.com/health